In today’s fast-paced tech and business arena, the saying “adapt or be left behind” is more relevant than ever. Coined by Microsoft’s CEO, it highlights the necessity of staying competitive in a world driven by innovation. Especially in the realms of data management and analytics, there’s a noticeable shift from traditional tools like Excel to more robust options like Power BI.
For devoted Excel users, moving to Power BI isn’t just a change—it’s a strategic step forward. While Excel has long been a data analysis powerhouse, the increasing complexity of data sets demands a more sophisticated solution. Power BI isn’t just a new tool; it represents a paradigm shift in data analytics, empowering users to visualize, analyze, and derive real-time insights.
This post explores why heavy Excel users should consider this transition. From improved visualization to seamless data integration and collaboration features, Power BI offers a suite of tools that align with the evolving needs of modern businesses. In a tech landscape that’s ever-changing, embracing innovative solutions isn’t just a choice; it’s a strategic necessity for survival and success.
It’s a shift beyond traditional spreadsheet functionalities, opening doors to a realm where data becomes a powerful asset for decision-making.
The move is not just about adopting a new tool; it signifies a strategic leap into a comprehensive platform that integrates collaboration, cloud-based convenience, and advanced analytics tools.
Microsoft Excel, a widely used spreadsheet tool, is known for data entry, calculation, and basic analysis. However, it comes with limitations in terms of advanced data handling.
Keep in Mind
spreadsheet software
data entry and calculation
basic data analysis
limited visualization options
manual processes
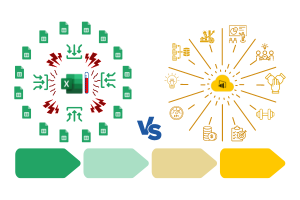
Excel’s Struggle: Managing large datasets in Excel can feel like lifting weights. As your data grows, so do the challenges.

Power Query is a data transformation tool that connects to various sources, cleanses and shapes data, and simplifies the data preparation process. It’s a game-changer in data handling.
Keep in Mind
Data Transformation Tool
Connects to Various Data Sources
Cleansing and Shaping Data
Eases Data Preparation
Included in both MS Excel and Power BI
Think of it as the essential stepping stone before the grand move to Power BI. The beauty is, you can master this transformative tool right within MS Excel. Power Query is where you refine your data handling skills, setting the stage for a seamless transition to Power BI.

Power Pivot, an in-memory data analysis tool, empowers you with data modeling, relationships, and calculations. Experience enhanced data analysis capabilities beyond the capabilities of Excel alone
Keep in Mind
In-memory Data Analysis Tool
Enables Data Modeling
Relationships and Calculations
Enhanced Data Analysis Capabilities
The best place to learn DAX language
It’s a dynamic space within MS Excel where you can take a significant step in becoming acquainted with the DAX language. This knowledge becomes a solid foundation as you progress towards mastering Power BI. Think of Power Pivot as your training ground for a seamless transition to advanced analytics.
Now, meet Power BI Desktop. This tool allows you to design reports and dashboards with advanced visualization tools, direct data connectivity, and seamless Power Query and Power Pivot integration.
Keep in Mind
Designing Reports and Dashboards
Advanced Visualization Tools
Direct Data Connectivity
Integration of Power Query and Power Pivot models
The best place to learn DAX language
Power BI Desktop is your creative canvas for designing insightful reports and interactive dashboards. It bridges the gap between data and visualization, empowering you to bring your data stories to life. This is where the magic happens, where raw data transforms into meaningful insights for decision-making.

This cloud-based platform takes your insights to new heights by fostering collaboration and providing access anytime, anywhere.
Keep in Mind
Team up effortlessly on shared reports
Access data anywhere, anytime
Share reports seamlessly with stakeholders
Keep data up-to-date with automatic refresh
Control access with powerful security features
Elevate your teamwork, enhance decision-making, and unleash the collaborative power of your data
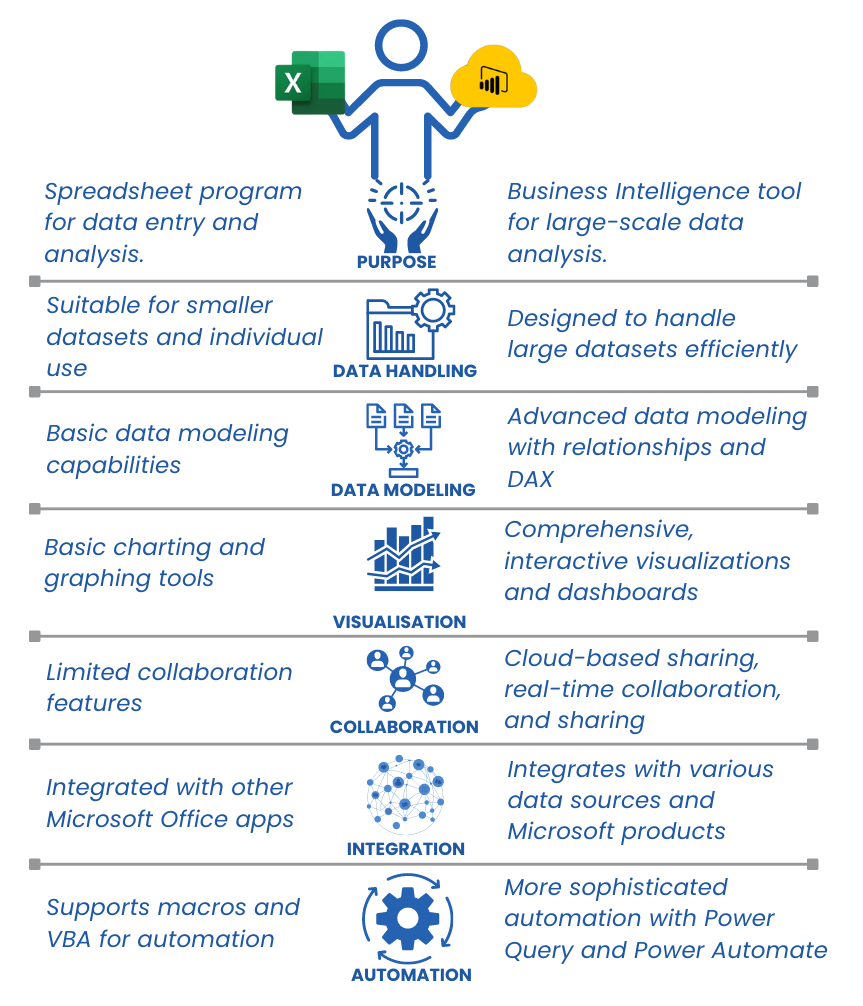
MS EXCEL
Versatile for basic data tasks.
Suitable for individual use.
Powerful, but with limitations in handling large datasets and advanced analytics.
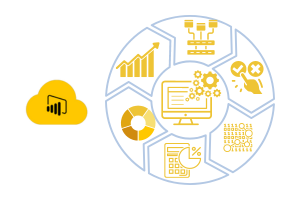
Power BI:
Purpose-built for advanced business intelligence.
Excels in handling large datasets and sophisticated data modeling.
Offers richer visualization options for interactive reports.
Enables seamless collaboration within organizations.
Integrates with diverse data sources for a cohesive data ecosystem.
Provides advanced automation for data refreshes.
Ideal for both individual users and organizations requiring robust business intelligence solutions.
1# MS EXCEL: Start by leveraging your strong Excel skills. Familiarize yourself with data manipulation, formulas, and basic analysis within Excel.
2# POWER QUERY: Dive into Power Query within Excel. Learn how to import, transform, and shape data using this powerful tool. This step prepares you for more advanced data handling in Power BI.
3# POWER PIVOT: Next, explore Power Pivot within Excel. Understand data modeling, relationships, and the use of DAX (Data Analysis Expressions) language. This step is crucial for transitioning to Power BI.
4# POWER BI: Move to Power BI Desktop. This standalone application allows you to create advanced visualizations, reports, and dashboards. Leverage your Excel skills and extend them with the enhanced capabilities of Power BI Desktop.
5# POWER BI advanced: Explore advanced features in Power BI Desktop, such as complex data modeling, custom visuals, and integrating additional data sources. This step helps you unlock the full potential of Power BI for in-depth analysis.
6# POWER SERVICE: Begin using Power BI Service. Upload your Power BI Desktop reports to the cloud, enabling collaboration and sharing with team members. Learn about features like scheduled data refresh and security settings.

Power BI isn’t just a tool; it’s a game-changer. It enhances collaboration, scales your analytical capabilities, and takes your insights to new heights. The decision to switch from Excel to Power BI opens the door to a world of possibilities for data-driven success.
Remember, this journey is ongoing. Continue exploring, learning, and applying Power BI to real-world scenarios. Whether you’re an analyst, business user, or data enthusiast, the mastery of Power BI is a continual process. Ready to unleash the full potential of your data? Keep discovering, keep mastering, and keep transforming your analytical journey with Power BI.